
Surface Roughness Measurement Methods Explained: Ra, Rz, Contact vs Optical
author
Why Surface Roughness Measurement Matters in Renewable Energy Manufacturing
In renewable energy manufacturing, surface roughness measurement is tied directly to equipment life, sealing quality, and operational safety.
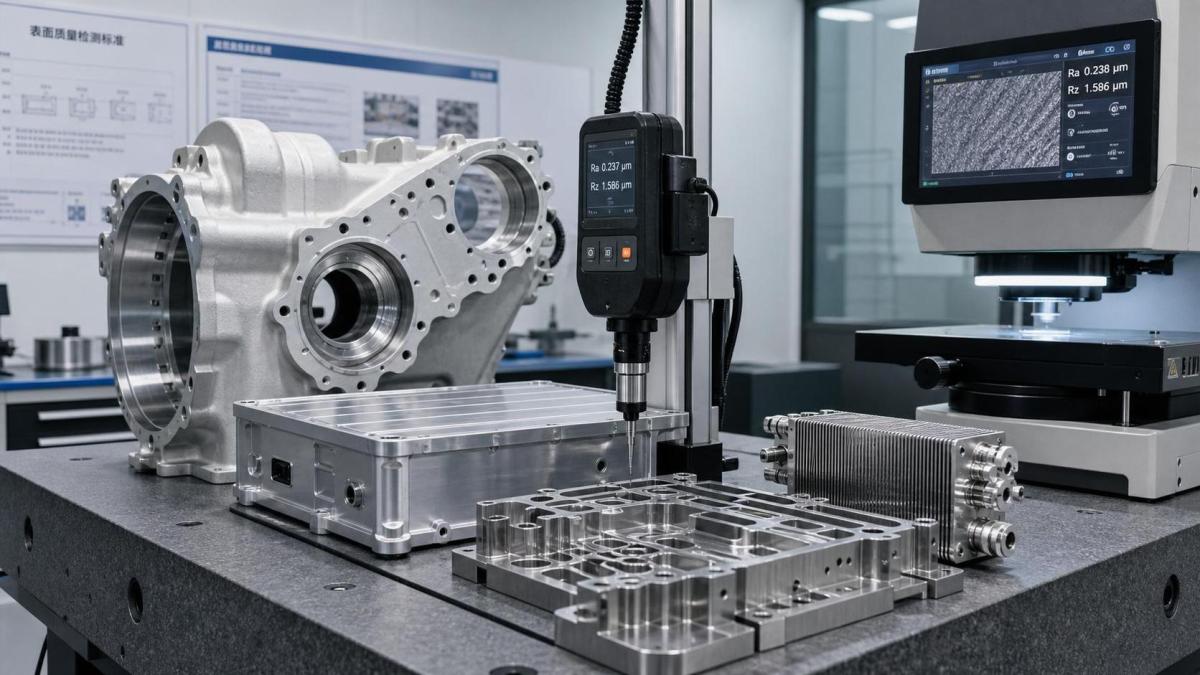
That becomes obvious on wind gearbox housings, battery enclosures, heat exchangers, valve seats, and coated structural parts.
If a surface is too rough, seals leak, coatings fail early, and friction rises.
If it is too smooth, lubricant retention may drop, bonding can weaken, and process costs increase without benefit.
This is why surface roughness measurement is not just a lab exercise.
It is a practical control point for production release, incoming inspection, and failure prevention.
From a quality perspective, the main challenge is consistency.
Suppliers may report different parameters, different cut-off settings, or different measurement methods for the same part.
That can create false comparisons and weak inspection decisions.
A reliable surface roughness measurement program needs the right parameter, the right method, and the right standard.
Ra and Rz Explained Without the Usual Confusion
The two most common values in surface roughness measurement are Ra and Rz.
They describe surface texture differently, so they should never be treated as interchangeable.
What Ra means
Ra is the arithmetic average of absolute profile deviations from the mean line.
In simpler terms, it shows the average roughness level across the measured length.
Ra is useful when process control needs a stable, easy-to-trend parameter.
Machining lines often use Ra because it is familiar, widely specified, and easy to compare over time.
What Rz means
Rz focuses more on peak-to-valley behavior within sampling lengths.
It highlights sharper texture features that Ra may smooth out.
That matters when a few deep valleys or high peaks can cause sealing or wear problems.
For gasket interfaces, coating prep, and contact surfaces, Rz may reveal risk earlier.
Why the difference matters
Two parts can have similar Ra values and very different Rz values.
In real inspection work, that difference changes risk interpretation.
A smooth average may hide isolated peaks that scratch seals or disrupt coating thickness.
So surface roughness measurement should start with one question.
What functional failure are you trying to prevent?
Contact Surface Roughness Measurement: Strengths and Limits
Contact surface roughness measurement usually means a stylus profilometer.
A small probe moves across the surface and records vertical changes along a line.
This method remains common because it is standardized, affordable, and well understood in industrial QA.
Where contact methods work well
- Machined metals with clear access paths
- Routine line inspection with fixed sampling rules
- Supplier comparison under the same parameter settings
- Applications requiring traceable Ra and Rz records
Where contact methods struggle
- Soft coatings or delicate surfaces that a stylus may mark
- Complex geometries with narrow channels or steep edges
- Large parts needing fast area-based inspection
- Highly textured surfaces where a single line misses local variation
This is the practical issue many teams overlook.
A line trace can be accurate, but still incomplete.
If the surface has directional machining marks or local defects, one track may not represent the whole feature.
Optical Surface Roughness Measurement: Faster Insight, Different Risks
Optical surface roughness measurement uses light instead of physical contact.
Common approaches include confocal microscopy, interferometry, and focus variation systems.
These tools generate areal data, not only a single profile line.
That makes them powerful for textured, delicate, or patterned surfaces used in advanced energy components.
Key advantages
- No probe contact, so there is less risk of damage
- Fast capture of larger areas
- Better visibility of local defects and texture direction
- Useful for thin films, coatings, and precision finished parts
Main limitations
- Reflective or transparent surfaces may be difficult to read
- Results depend heavily on setup, filtering, and operator discipline
- Equipment cost is usually higher
- Cross-correlation with stylus data is often needed during qualification
In other words, optical systems are not automatically better.
They are better when the surface, the failure mode, and the inspection objective support them.
How to Choose the Right Surface Roughness Measurement Method
For most teams, the decision is not contact versus optical in the abstract.
It is which method gives repeatable, decision-grade data for the actual part.
Use this selection logic
- Define the functional requirement first, such as sealing, wear, adhesion, or fatigue.
- Confirm which parameter fits that risk, often Ra, Rz, or an areal equivalent.
- Check material type, coating condition, and geometric accessibility.
- Align cut-off, evaluation length, filtering, and standard references.
- Run correlation studies before changing methods across suppliers or plants.
This step is especially important in renewable energy supply chains.
Parts often come from different regions, machining processes, and finishing standards.
Without method alignment, surface roughness measurement data may look comparable while meaning very different things.
A quick decision table
Standards, Reporting, and Common Inspection Mistakes
Good surface roughness measurement depends on more than the instrument.
It also depends on disciplined reporting.
When reports omit the standard, cut-off length, filter, or trace direction, the numbers lose context.
That is where many approval errors begin.
Common mistakes to avoid
- Comparing Ra values measured under different cut-off settings
- Approving parts based on Ra when failure risk is peak related
- Switching from contact to optical without correlation study
- Using too few measurement locations on large functional surfaces
- Ignoring lay direction on machined or ground features
For audit-ready reporting, each surface roughness measurement record should include the parameter, standard, instrument type, sampling rules, and acceptance limits.
That level of detail supports traceability during warranty review, incident analysis, and supplier escalation.
Practical Takeaway for Safer, More Reliable Inspection Decisions
The best surface roughness measurement program is the one that links texture data to part function and field risk.
Ra is useful for broad control.
Rz is often better for finding dangerous peaks and valleys.
Contact methods remain strong for standardized production checks.
Optical methods bring speed and richer data where geometry or surface sensitivity demands it.
In practice, the strongest approach is usually not choosing one method forever.
It is building a decision rule for when each method should be used.
That gives cleaner supplier comparisons, fewer false approvals, and stronger protection for renewable energy assets operating under long service cycles.
Review your current specifications, confirm whether Ra alone is enough, and validate that every surface roughness measurement in your workflow is truly fit for purpose.
Protocol_Architect
Dr. Thorne is a leading architect in IoT mesh protocols with 15+ years at NexusHome Intelligence. His research specializes in high-availability systems and sub-GHz propagation modeling.
Related Recommendations
- NHI Data Lab (Official Account)How Customizable IoT Components Enable Scalable Solar and Energy Monitoring Systems
- NHI Data Lab (Official Account)Hardware Benchmarking for Vibration Testing: Metrics for Comparing Test Systems
- NHI Data Lab (Official Account)IoT Sourcing Guide for Distributors: Vet Suppliers, Certifications, and Supply Risk
- NHI Data Lab (Official Account)How to Evaluate a CNC Automation Manufacturer for Custom Production Lines
- NHI Data Lab (Official Account)Interactive Brokers Adds Bucharest Exchange Trading Access
- NHI Data Lab (Official Account)How to Plan RoHS Compliance for Commercial IoT Devices Before Mass Production
- NHI Data Lab (Official Account)How to Assess Supplier Capability in Southeast Asia for Renewable Energy Projects
- NHI Data Lab (Official Account)How Surface Mount PCB Assembly Improves Reliability in Renewable Energy Devices
- NHI Data Lab (Official Account)Sensor Surge Extends South China PCBA Lead Times
- NHI Data Lab (Official Account)SLA 3D Printing China: How to Evaluate Quality, Lead Time, and Export Support
Analyst